Data Analytics Professional
RACHEL SMITH
Business Analytics | Data Visualization | Financial Analysis | Python | SQL | Tableau | Power BI
I transform complex data into actionable business insights through analytics, automation, and interactive dashboards. My experience combines business operations, financial analysis, Python programming, SQL, Tableau, and Power BI to solve real-world problems while maintaining data integrity and clear executive reporting.

- Email: Joylikerachel77@gmail.com
- Phone: (503)435-9557
About Me
Always learning, always building
My technical toolkit includes Python, SQL, Tableau, Power BI, Microsoft Excel, and statistical analysis techniques. I am continually expanding my skills in machine learning, automation, and artificial intelligence to stay current with the rapidly evolving field of analytics.
Beyond technical skills, I believe successful analysts are effective communicators. Numbers alone do not create value—clear explanations, compelling visualizations, and actionable recommendations do. I enjoy bridging the gap between technical analysis and business strategy by presenting complex information in ways that help decision-makers act with confidence.
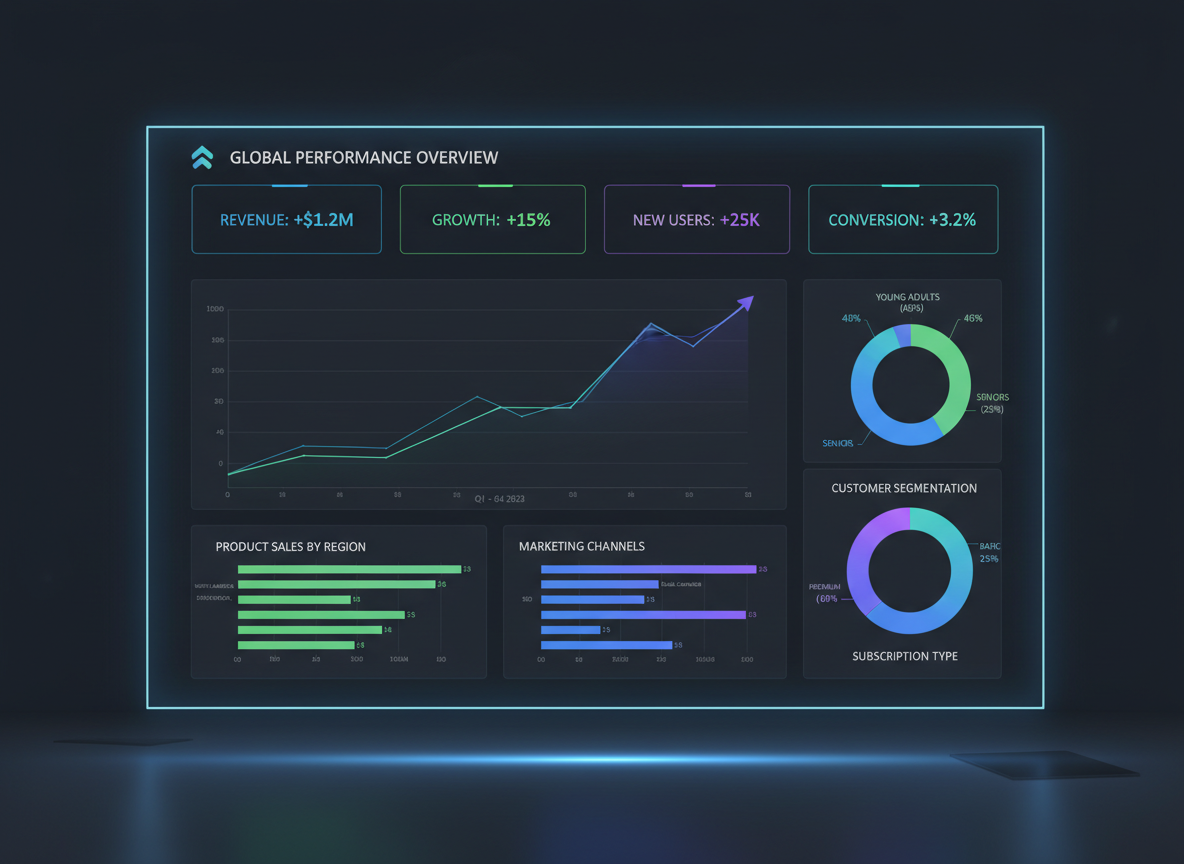
Interactive dashboards that turn raw numbers into decisions leaders can act on.
Skills & Tools
 Rachel Smith