
Data Analytics Portfolio
Welcome to my professional data analytics portfolio. This website showcases a collection of projects that demonstrate my ability to transform complex data into meaningful business insights through thoughtful analysis, visualization, and strategic decision-making. Each portfolio project is presented as a comprehensive case study, outlining the business challenge, project objectives, analytical methodology, tools and technologies utilized, key findings, and measurable outcomes. Rather than simply displaying dashboards or code, these projects illustrate my complete analytical process—from understanding the business problem and preparing reliable data to developing actionable recommendations that support organizational goals. Throughout this portfolio, you will find examples of work involving Python, SQL, Tableau, Power BI, financial analysis, machine learning, and business intelligence, all grounded in a commitment to data integrity, continuous learning, and evidence-based decision-making. Whether you are a recruiter, hiring manager, or fellow analytics professional, I invite you to explore these projects and see how I combine technical expertise, business acumen, and a passion for solving real-world problems through data.
Technical skills
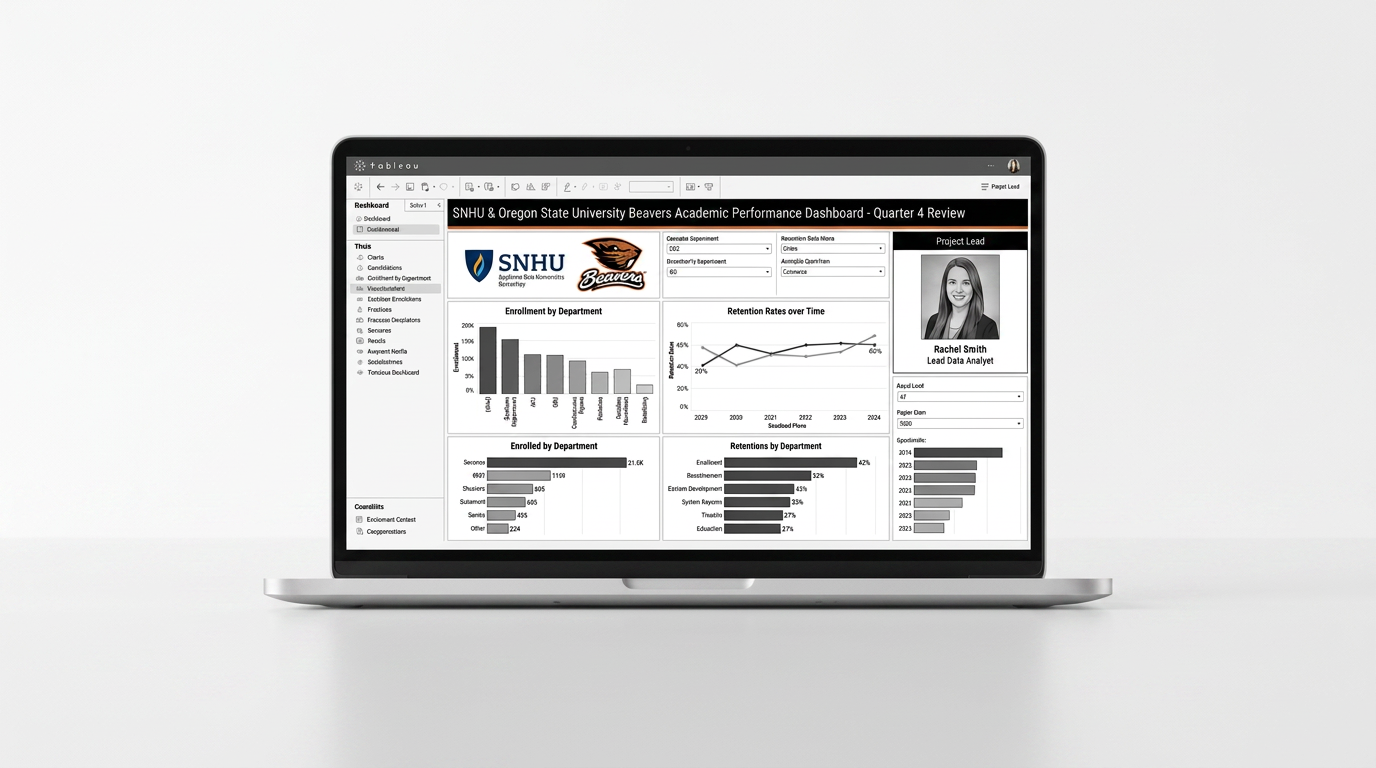
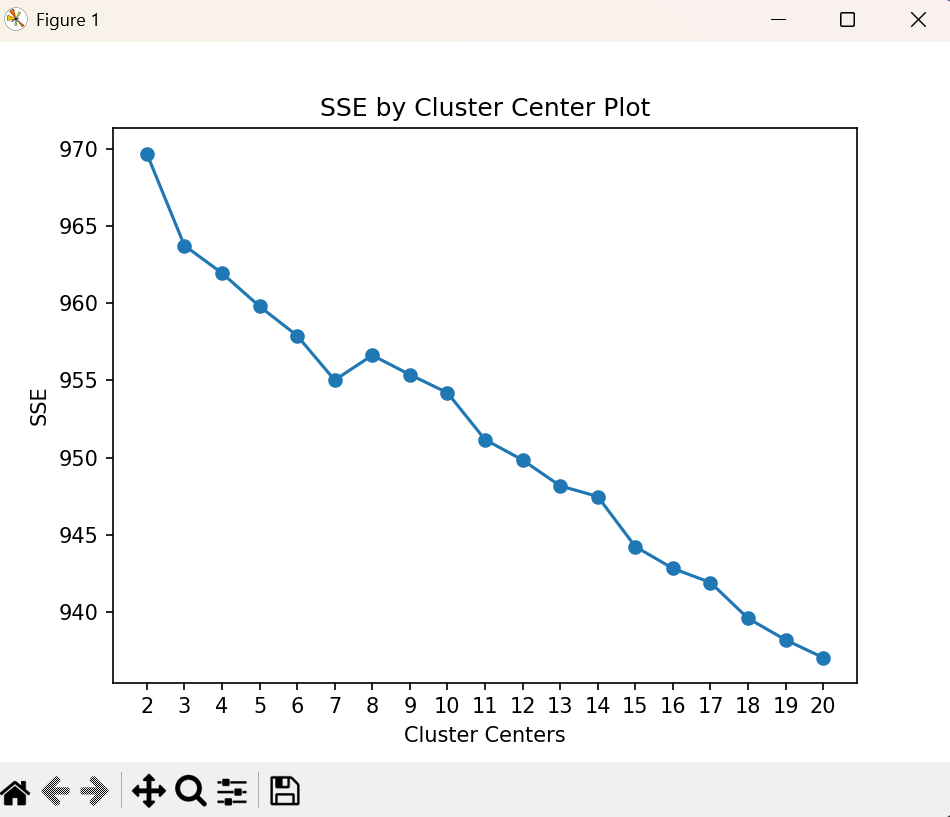
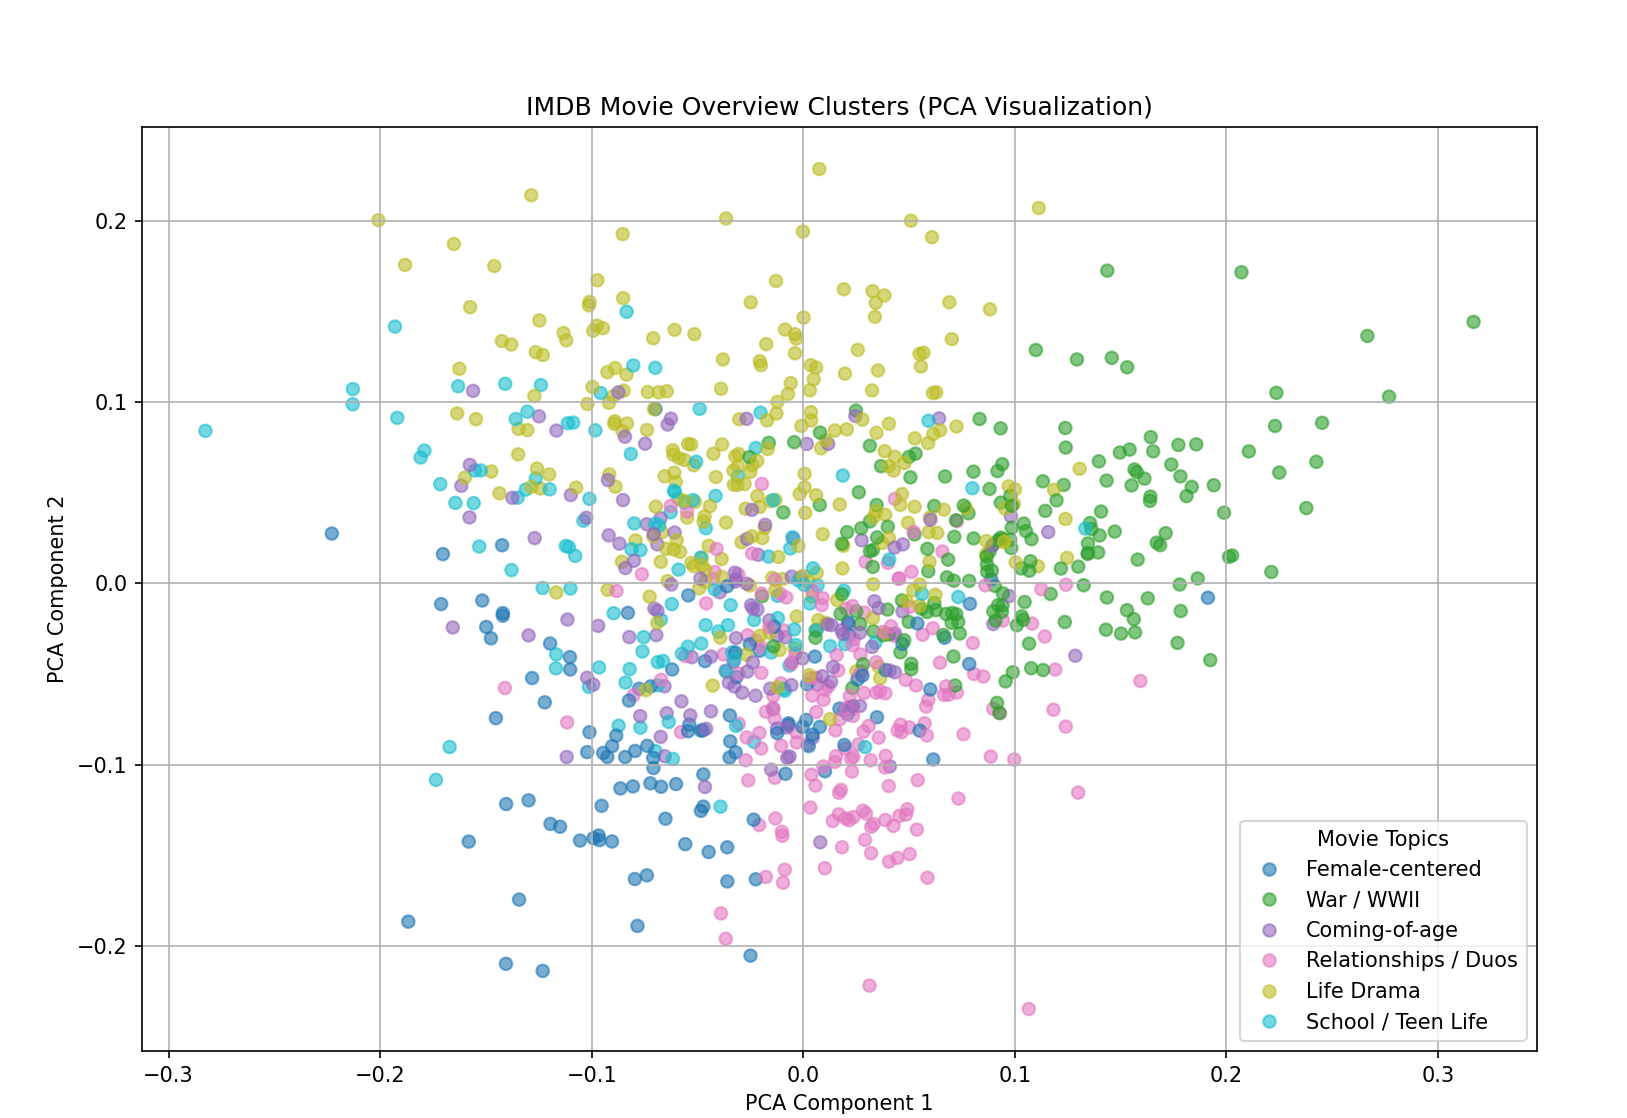
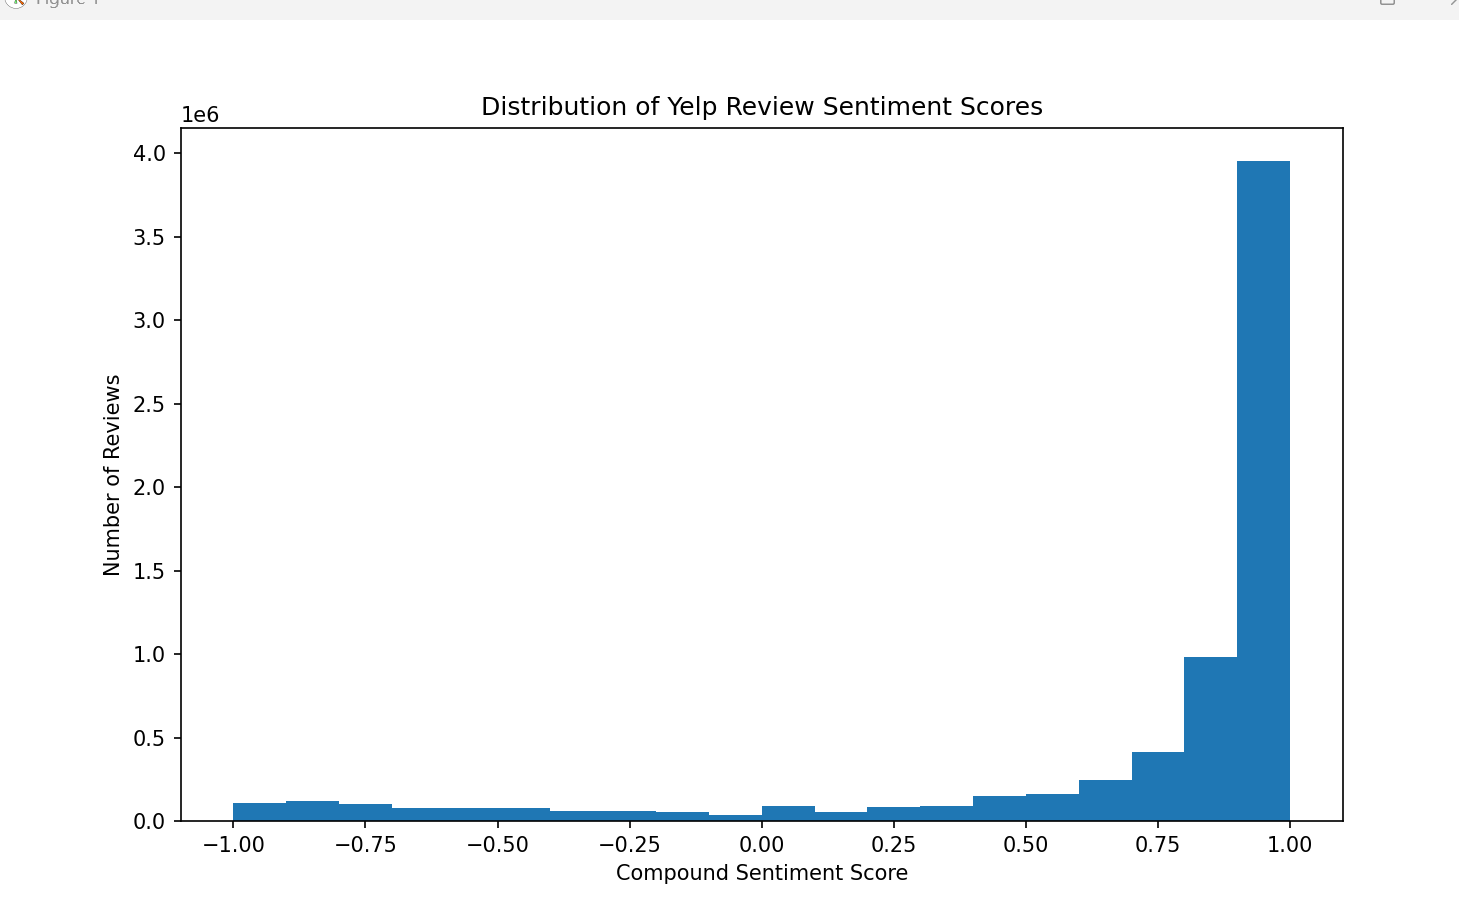
My technical and analytical skill set combines business knowledge with modern data analytics tools to transform complex information into actionable insights. I am proficient in Python, SQL, Microsoft Excel, Tableau, and Power BI for data extraction, cleaning, analysis, automation, and interactive dashboard development. My experience includes working with large datasets, performing statistical analysis, creating data visualizations, developing financial models, and applying machine learning techniques to identify trends, patterns, and opportunities for process improvement. I have a strong understanding of data integrity, database management, business intelligence, and performance measurement, with the ability to communicate technical findings through clear visualizations and executive-level reporting. Complementing my technical expertise are strengths in critical thinking, problem-solving, project management, collaboration, and continuous learning, allowing me to approach complex business challenges with a strategic, data-driven mindset and deliver solutions that support informed decision-making and operational excellence.
Testimonials

Hope D.
Rachel turned scattered financial data into clear dashboards that finally aligned our operations, finance, and executive teams.

Hope D.
Her Python automations cut manual reporting time by 60 percent and reduced data errors, giving leadership confidence in weekly metrics.

Hope D.
Rachel quickly understood our business model, asked smart questions, and delivered insights we used directly in our board presentation.

Hope D.
The Tableau and Power BI dashboards she built make complex operations data approachable for non-technical stakeholders across our organization.
 Rachel Smith