
Analytics Projects

In-depth case studies highlighting Rachel’s analytics, automation, and visualization projects from problem statement to measurable impact.
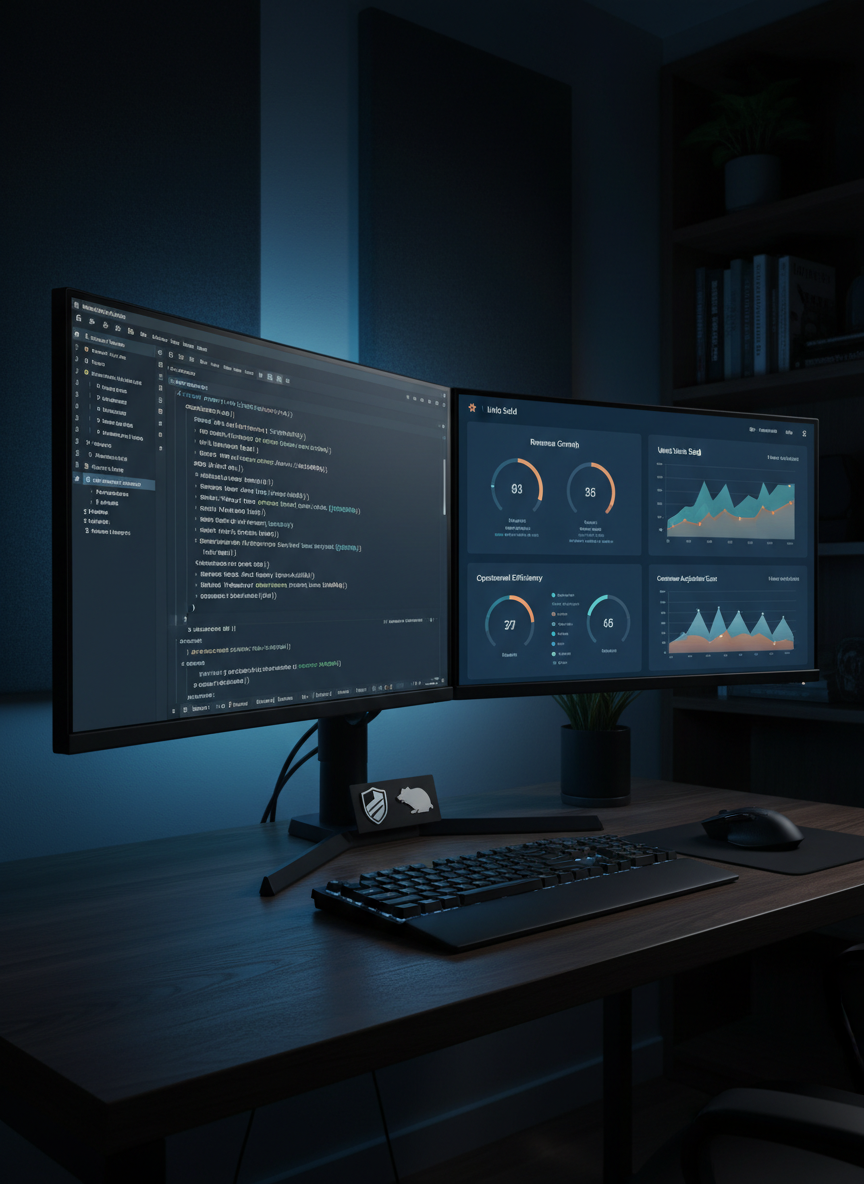
A dark, sophisticated dual-monitor setup in a dimly lit office, with one screen showing clean Python code for data automation and the other a polished dashboard of sales and operations metrics. The matte-black keyboard and mouse rest on a wooden desktop with a faint grain texture. Discreet badges on the monitor base use abstract shield and beaver-like silhouettes to allude to Southern New Hampshire University and Oregon State University, rendered as non-text, non-branded shapes. A cool blue backlight glows behind the screens, creating a focused, high-tech ambiance. Photographic realism, three-quarter angle shot, strong contrast between screens and dark surroundings to emphasize automation and analytics expertise.

Casework

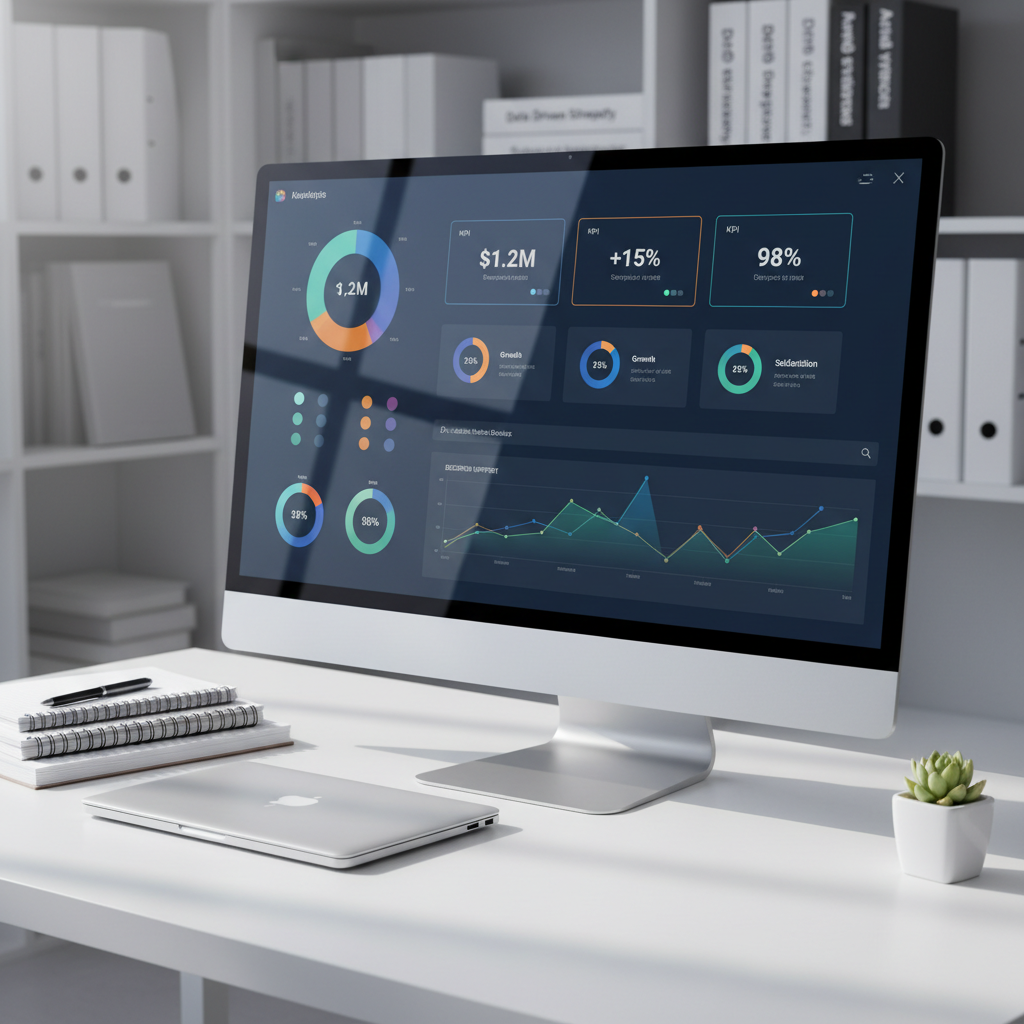
A sleek, ultra-wide computer monitor displaying a vibrant, interactive business dashboard filled with colorful charts, KPI cards, and trend lines, set on a clean white desk. Around the monitor are neatly stacked notebooks, a closed silver laptop, and a minimalist desk plant suggesting an organized analytics workspace. Soft studio lighting from the left creates subtle reflections on the screen and desk surface, with gentle shadows adding depth. The background is softly blurred shelves of analytical reports and binders. Shot at eye level with a slight angle, photographic realism, sharp focus on the dashboard, creating a professional, focused mood that highlights data analytics as a tool for decision making.

Services

Explore Rachel’s analytics offerings organized by how they solve business problems—from interactive dashboards to forecasting models and workflow automation. Quickly find examples that match your needs and see how complex data becomes clear, decision-ready insight.

About

Project Data, Tools, and KPIs

Review the data sources, tools, and metrics behind each project, including SQL databases, Python scripts, Tableau and Power BI dashboards, and the KPIs tracked for stakeholders—from revenue and cost savings to operational efficiency and customer experience.
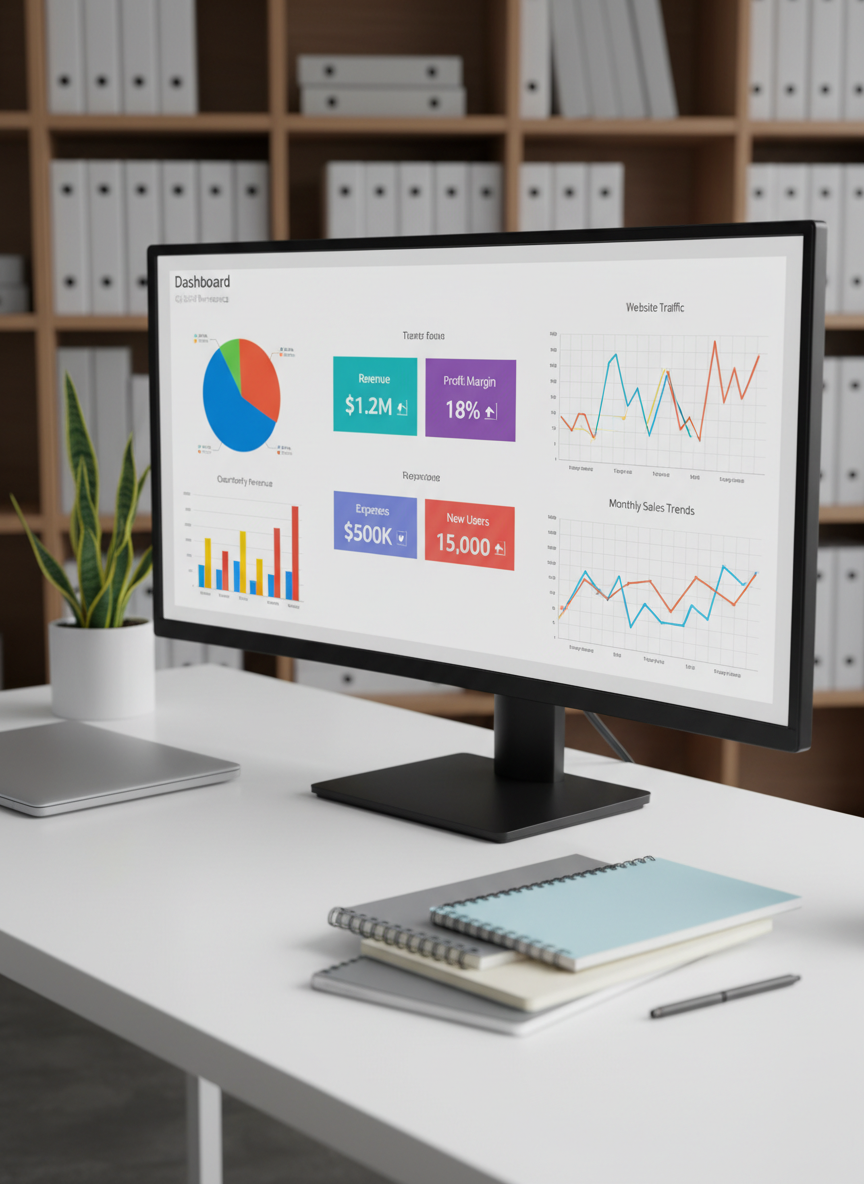
A sleek, ultra-wide computer monitor displaying a vibrant, interactive business dashboard filled with colorful charts, KPI cards, and trend lines, set on a clean white desk. Around the monitor are neatly stacked notebooks, a closed silver laptop, and a minimalist desk plant suggesting an organized analytics workspace. Soft studio lighting from the left creates subtle reflections on the screen and desk surface, with gentle shadows adding depth. The background is softly blurred shelves of analytical reports and binders. Shot at eye level with a slight angle, photographic realism, sharp focus on the dashboard, creating a professional, focused mood that highlights data analytics as a tool for decision making.